
Understanding ESG – Utilities perspective
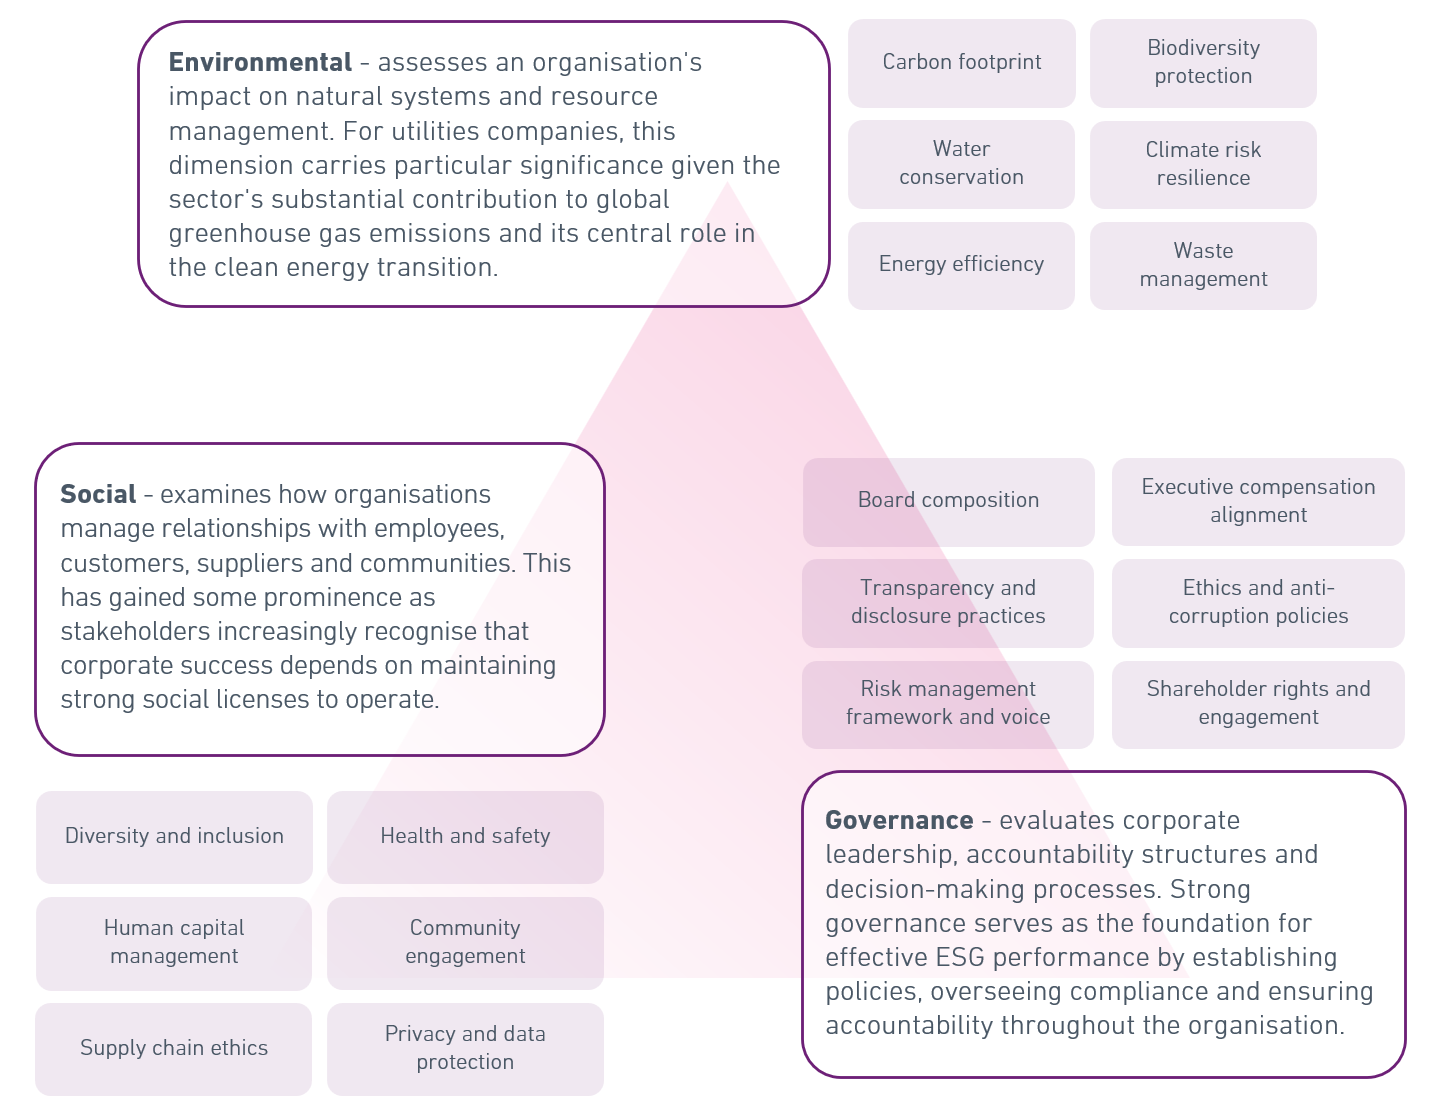
Environmental, Social, and Governance (ESG) represents a comprehensive framework that evaluates how organisations manage risks and opportunities related to sustainability, social responsibility, and ethical leadership. “ESG” first appeared in a 2004 United Nations report but it has evolved from a peripheral consideration into a strategic imperative that fundamentally shapes corporate decision-making, capital allocation, and stakeholder relationships. ESG extends beyond traditional sustainability concepts by providing tangible metrics and data points that inform investment decisions, regulatory compliance, and operational strategy across three interconnected pillars.
In this spotlight we focus on active, registered utilities companies in New Zealand. By analysing ESG scores and rankings, we identified the top 100 companies across the utilities sector and completed a detailed profiling and market comparison analysis.
Analysis Methodology
The analysis in this report is a profiling analysis and market comparison of the utilities companies rated highly on ESG scores (top 100) vs. the rest of the utilities companies in New Zealand. Location, company size, turnover, risk scores were analysed to highlight key differences between the highest rated ESG utility companies and the rest.
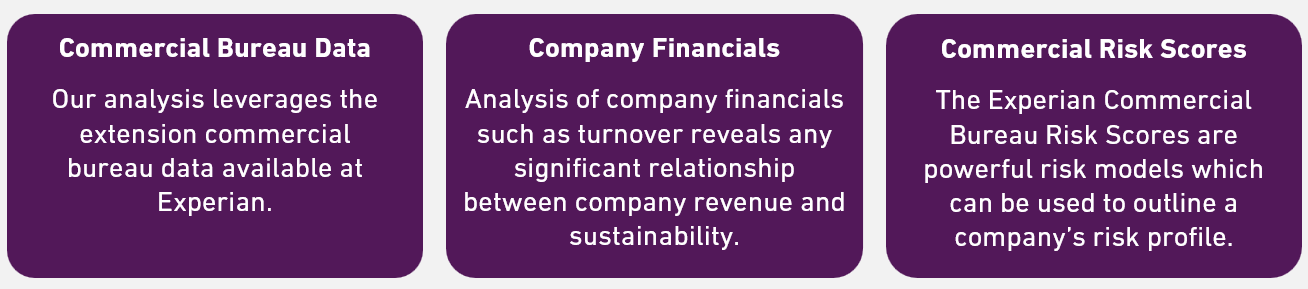
In this analysis, we profile the 100 companies rated highly on ESG initiatives/scores and compare the profiles of other utilities companies across New Zealand. On the Experian Commercial Bureau, there are approximately 1,200 active utilities companies across the country.
New Zealand utilities – Power players vs. rest of the grid
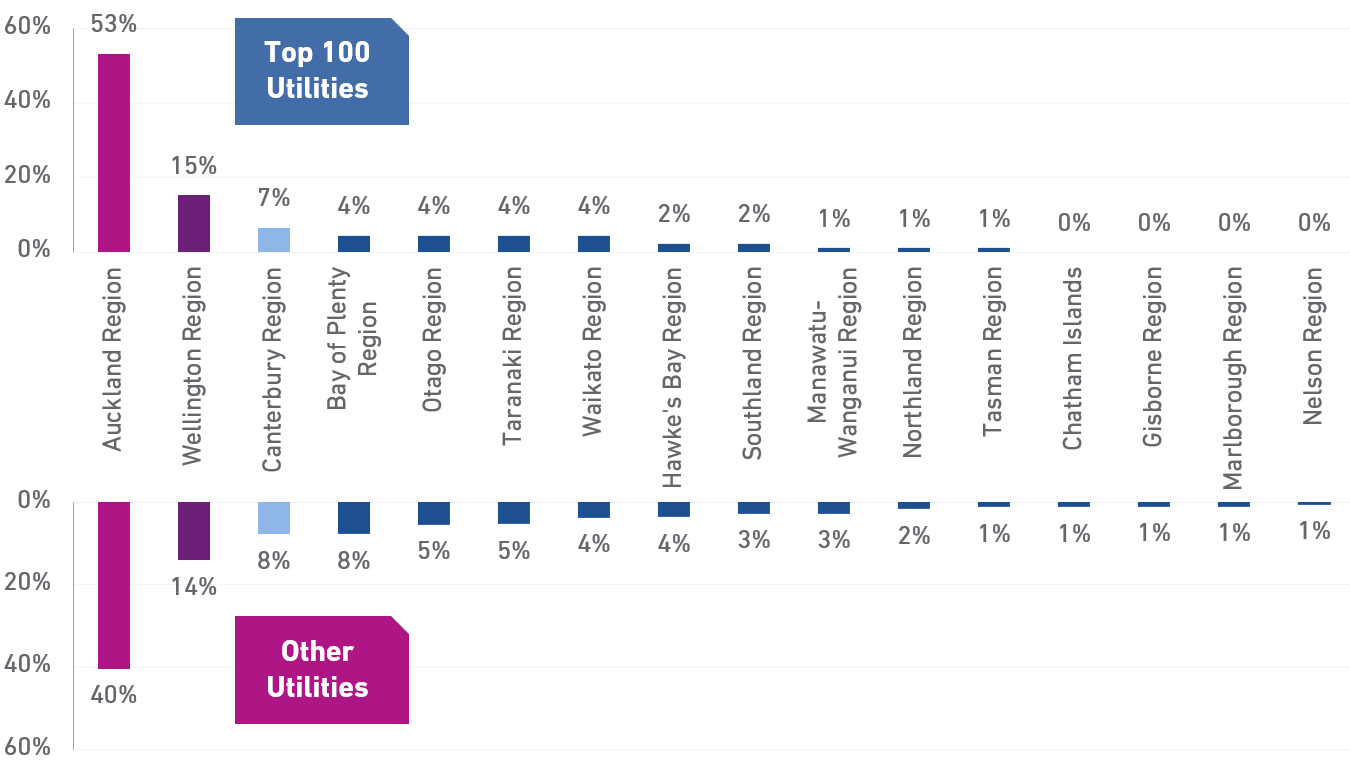
Auckland has a higher proportion of top 100 ESG companies compared to the rest of the country, 53% (vs. national proportion of 40%). This is likely attributed to factors such as: differences in urban density where denser areas have higher sustainability standards; local council differences and more ambitious climate action plans; larger customer based enabling initiatives such as smart grids and EV infrastructure; access to more innovation resources (people, tech-hubs).
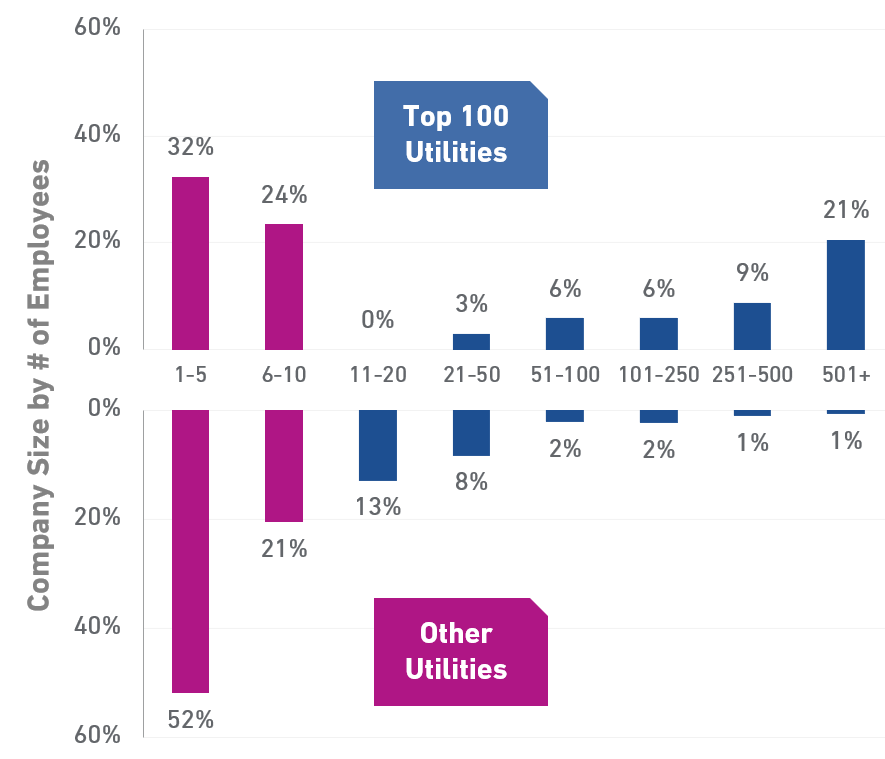
The company size by employee number distribution show a clear difference between the top 100 and the rest of the field. The highest rated utilities are predominately very small or very large companies.
Scale enables ESG investment, with 30% of the top 100 having over 100 staff, indicating that organisational scale help provides resources, expertise and operational capacity for comprehensive ESG programs.
However, specialisation also plays and interesting role – the significant presence of small companies amongst ESG leaders represent specialised consulting firms, renewable energy developers, or technology-focused utilities that built ESG principles into their core business model from start-up/early growth stages. The relative scarcity of mid-sized companies(11-100 employees) among ESG leaders suggests that companies at this scale may struggle
to prioritise ESG investment while managing growth pressures. 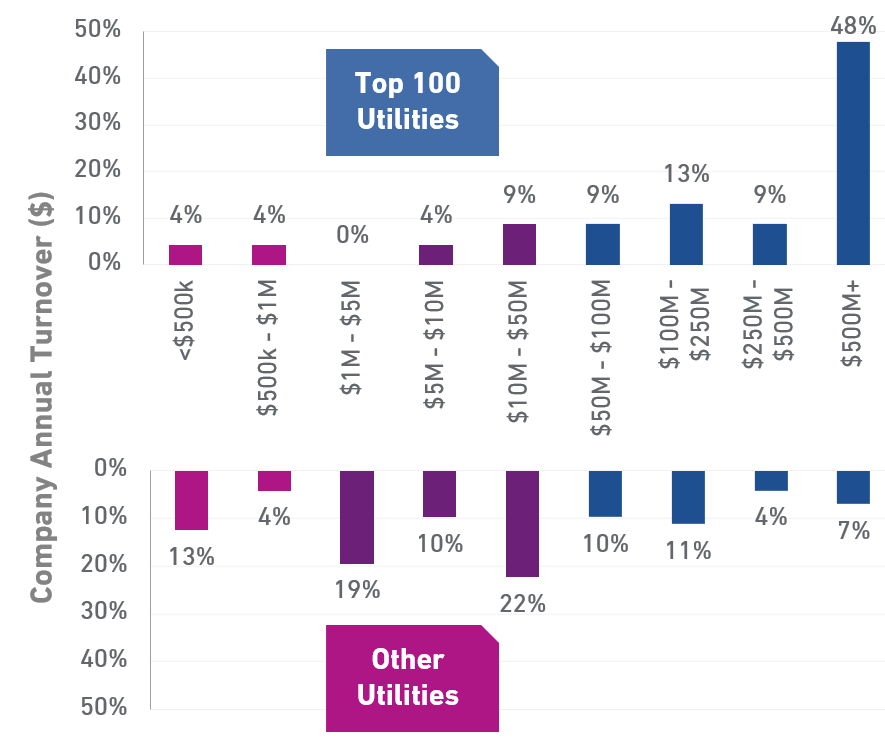
Almost 79% of the top 100 generate over $50m annually, showing that substantial financial capacity remains a critical enablerof ESG programs.
ESG is a strategic investment– those with higher financial resilience can absorb the upfront costs of renewable infrastructure, smart grid technology and comprehensive reporting systems.
The age distribution shows a fascinating pattern regarding corporate maturity and sustainability leadership. The top 100 ESG companies show an unusual concentration in the 1-2 year bracket (36%), significantly higher than other utilities (5%), while demonstrating comparable or higher representation across most other age categories.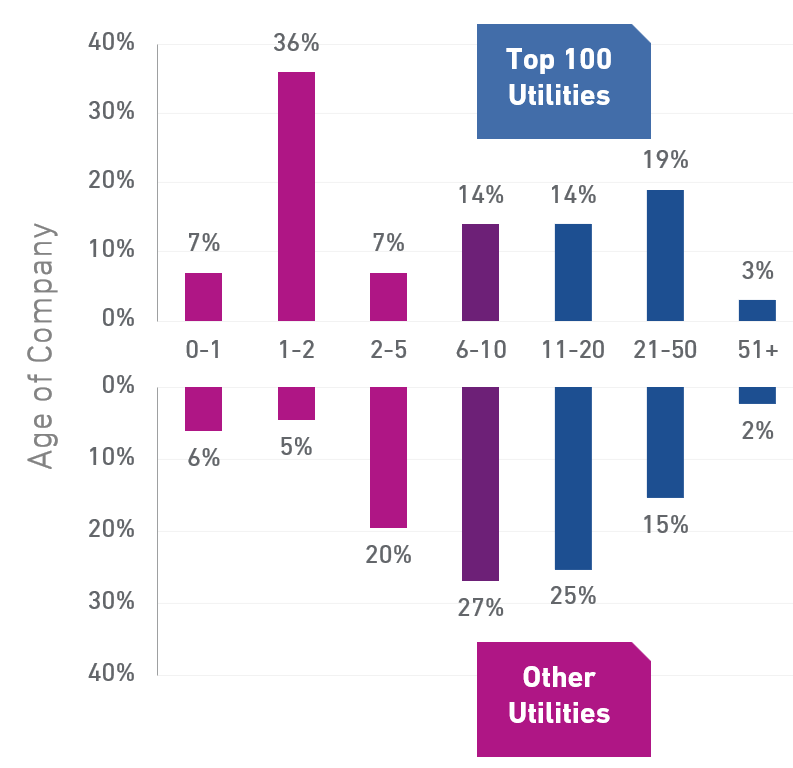 This concentration suggests a wave of purpose-built utilities entering the market with ESG embedded within the foundations and ethos of the company (likely emerged/emerging to capitalise on NZ’s renewable energy transition such as solar business models, batteries, EV infrastructure, energy efficiency services).
The middle years appear to be more challenging, with other utilities peak in the 6-20 year age range (52% combined), representing companies established during periods of less stringent ESG expectations now facing the challenge of retrofitting sustainability into legacy business models and infrastructure.
The age distribution suggests two viable pathways to ESG leadership: building sustainability into the organisational blueprint from day one or, committing to comprehensive transformation as an established enterprise. Companies in the middle years face the greatest strategic challenge – old enough to have legacy infrastructure and processes, yet young enough to lack the capital reserves for transformations.
Evaluating the Top 100 ESG rated Utilities
The analysis evaluated ESG performance within the New Zealand utilities sector by using both proprietary and publicly available data. The evaluation was done using a combination of: ESG scores available through the Experian Bureau and partners; Yahoo Finance scores, Sustain analytics (Morningstar) risk ratings; MSCI ESG Ratings; Forsyth Barr ESG assessment reports; and our subject matter experts within the Experian Analytics Consulting & Insights team.
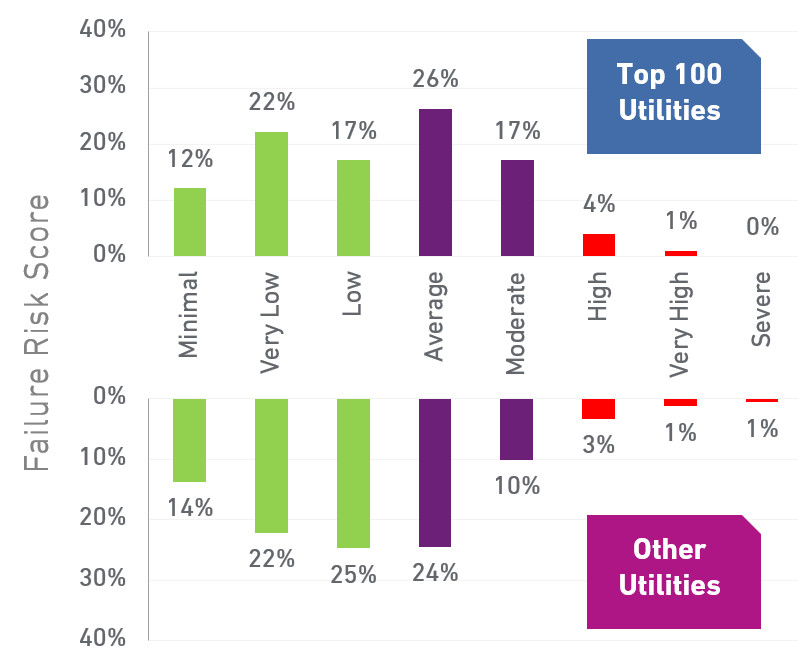 This analysis leverages Experian commercial risk scores – Failure Risk (probably of a company failing in the next 12 months) and Late Payment Risk (probably of a company being significantly delinquent in the next 12 months).
Investment in ESG initiatives is not without its risks. The relatively high proportion of the top 100 companies at “Average“/”Moderate” failure risk (left charts – 43% vs 34%) suggests that while ESG leaders are actively investing in growth and transformation, it may temporarily elevate risk profiles.
The late payment risk distribution reveal similar patterns, with less companies in the lower risk bands, and 73% in the “Average”/”Moderate” late payment risk band (bottom charts) vs 54% in other utilities.
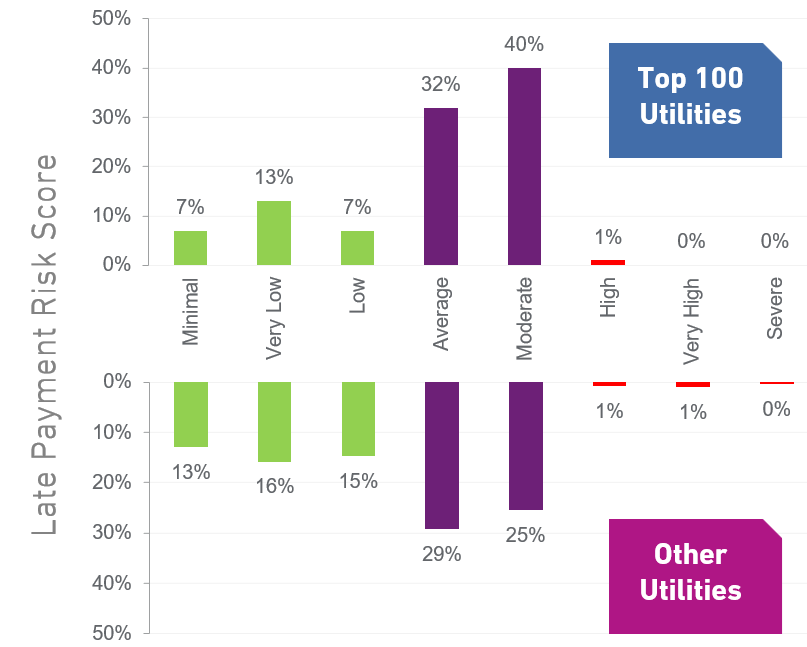 Strong governance and strategic clarity is great for ESG but ambitious or long-term ESG programs can create temporary working capital pressures and risks.
The risk profiles suggest ESG leadership requires financial sophistication to balance transformation investment with operational stability.
How can we help?
Market insights provide our clients with a deep understanding of their competitive landscape, customer behaviour and market dynamics. By leveraging internal data, industry benchmarks, and external market intelligence, these services can help uncover trends, identify growth opportunities, and inform strategic decision-making. Turn market intelligence into competitive advantage with data-driven insights that drive growth. Contact us to find out how.
Like what you’re reading? We release the Experian Business Pulse Monthly each month and features a Spotlight topic, much like this article. To get the latest reports directly to your inbox, be sure to subscribe.
Contact Us
Disclaimer: This report is provided by Experian Australia Pty Ltd general information and it is not (and does not contain any form of) professional, legal or financial advice. Experian and its related bodies corporate make no representations, warranties or guarantees that the information (including links and the views / opinions of authors and / or contributors) contained in this report are error free, accurate or complete. You are solely responsible and liable for any decision made (or not made) by you in connection with the information contained in this report. Experian (and its related bodies corporate) exclude, to the extent permitted by law, all liability for any and all loss, cost, expense, damage or claim incurred by a party as a result of or in connection with (whether directly or indirectly) this report or any reliance on the information in this report or links contained within. Nothing in this disclaimer excludes, restricts or modifies any rights or remedies that cannot be excluded, restricted or modified under applicable law. Experian and its related entities own, or are licensed to use, the intellectual property rights in this report and its contents. Except as permitted by law, the contents of this report must not be reproduced, modified, distributed or republished without Experian’s prior written consent.
Experian and the Experian marks used herein are service marks or registered trademarks of Experian or its related entities worldwide. Other product and company names mentioned herein are the property of their respective owners.