
A Trans‑Tasman view of affordable luxury spending
Affordable luxury: Modest indulgences in a high‑cost world
Affordable luxury refers to accessible indulgences – small, discretionary purchases that feel premium, such as prestige beauty, fragrance, treat‑oriented food and beverage, or experience‑led spend, yet sit well below the price of true luxury goods.
From an economic perspective, this reflects a mix of income effects and substitution: when real incomes are squeezed or uncertainty rises, households tend to defer larger, postpone-able purchases and redirect spending toward lower‑cost items that still deliver emotional value. Rather than switching off discretionary spend altogether, consumers often trade down in ticket size, preserving wellbeing, identity and confidence through purchases that remain financially manageable.
In downturns, this shows up less as outright contraction and more as a reshaping of spending habits. For example, shifting away from apparel and toward comparatively affordable premium personal‑care items. As a result, affordable luxury offers a clear lens on consumer sentiment, revealing how households protect small moments of aspiration when budgets are under pressure.
Two paths through a cost‑of‑living squeeze
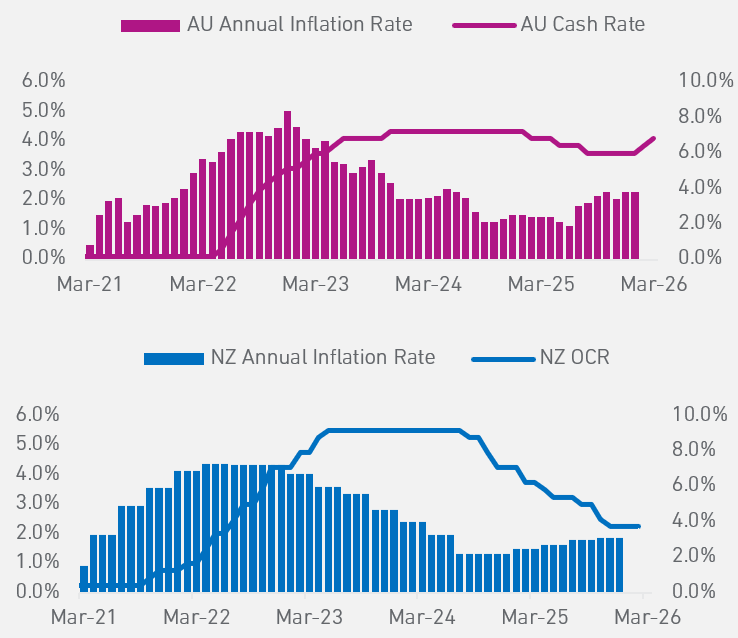 While both markets followed a similar path through the inflation shock of 2022, their monetary journeys have since diverged. Australia remains in a prolonged high‑rate environment as inflation proves stubborn, whereas New Zealand moved earlier and harder and has begun easing sooner as price pressures cooled.
These differing paths have shaped borrowing costs, disposable income, and consumer confidence in distinct ways. Amid this pressure, affordable luxury spending has shown notable resilience, with consumers trading down on big‑ticket items while still prioritising smaller, emotionally rewarding indulgences, setting the stage for the insights explored in this report.
Experian Spend Analytics
Underlying Spend Analytics are many millions of transactions across AU and NZ, revealing spending habits across time. This dataset provides a comprehensive view of consumers’ financial wallets, covering salaries, direct debits, loans, deposits, and expenses. It is deidentified and adheres to our strict data privacy and retention policies.
Blend Spend Analytics with your internal data for powerful insights.
Making up for it: The resilient glow of personal product
Across Australia and New Zealand, the personal care spend category has proven itself to be one of the most tenacious trends in the face of tightening monetary policy. If there was any need to validate Leonard Lauder’s famed “Lipstick Index“, this would be the data to reference. It’s the idea that lipstick (and other small “affordable luxuries”) sales often rise when the economy weakens, as people skip big splurges but still buy small treats.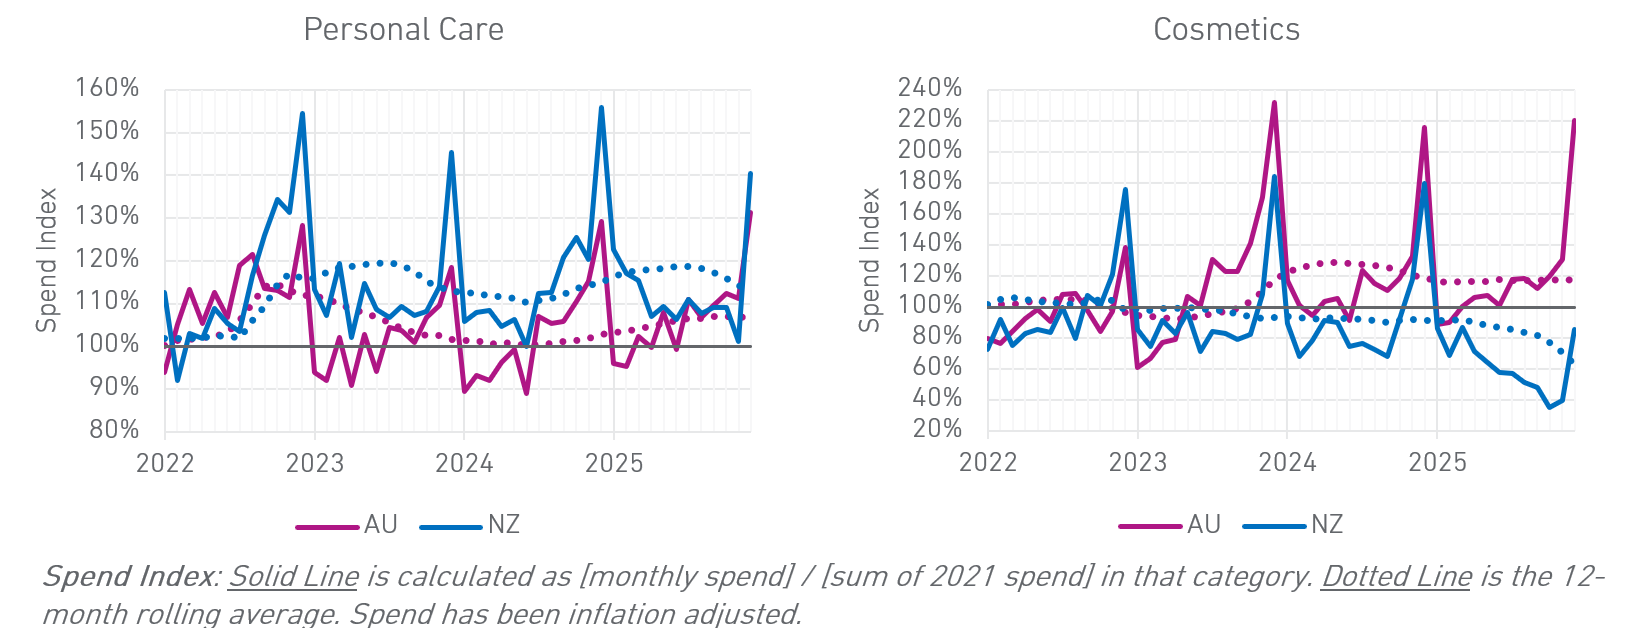
Being highly seasonal, the Spend Index in Dec-25 for both personal care and cosmetics in Australia reached 131% and 220% respectively. For New Zealand, the uplift is even more striking, at 140% in Dec-25 (and previous holiday periods have been even higher), though less so for cosmetics. Under financial stress, consumers forgo big-ticket purchases and permit themselves smaller, “more” affordable substitution. There would be other reasons as well: increase in personal care (e.g. massages, grooming services, wellness services) is a healthier way to keep the doctor (and their bills) away; more affordable or generic brands of cosmetics with a lower average unit price which helps sustain usage; and greater outreach to wider audiences through social media and influencers – a channel which has really exploded in the last half-decade.
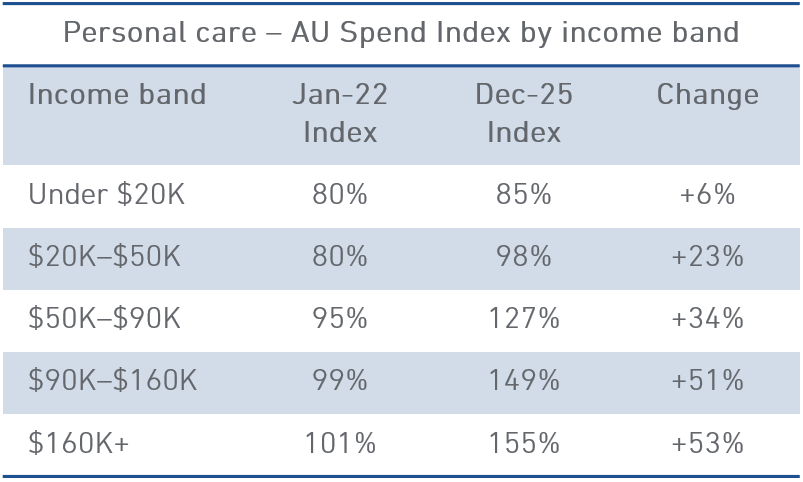 Income segmentation, however, reveals a socially significant difference. Lower‑income spenders are spending more-or-less the same as they did five years ago. Middle‑income segments show a meaningful 34% lift, consistent with the “aspirational middle class” that cosmetics brands and salons most effectively target – spending more on personal care as a conscious, affordable indulgence within their budget.
The home ecosystem in the face of inflation
Spending at home (or on the home), however, is showing some differing trends. Overall spend on household furnishings have been down, with Spend Index % rolling averages of mid-80s and 60s respectively for AU and NZ over the past 2 years – a drastic decrease since the central banks started to raise rates. Apart from the purchase spikes around Nov/Dec (aided by Black Friday discounts and end-of-year sales), consumers have wound back on buying large household goods. Especially in NZ – where the Spend Index plummeted to 47% – more than halving from baseline – before recovering partially to 74% in Dec-25. This isn’t a cyclical dip; it reflects the genuine structural contraction in spending – New Zealanders adapted their budgets to be thriftier and opting against redecorating.
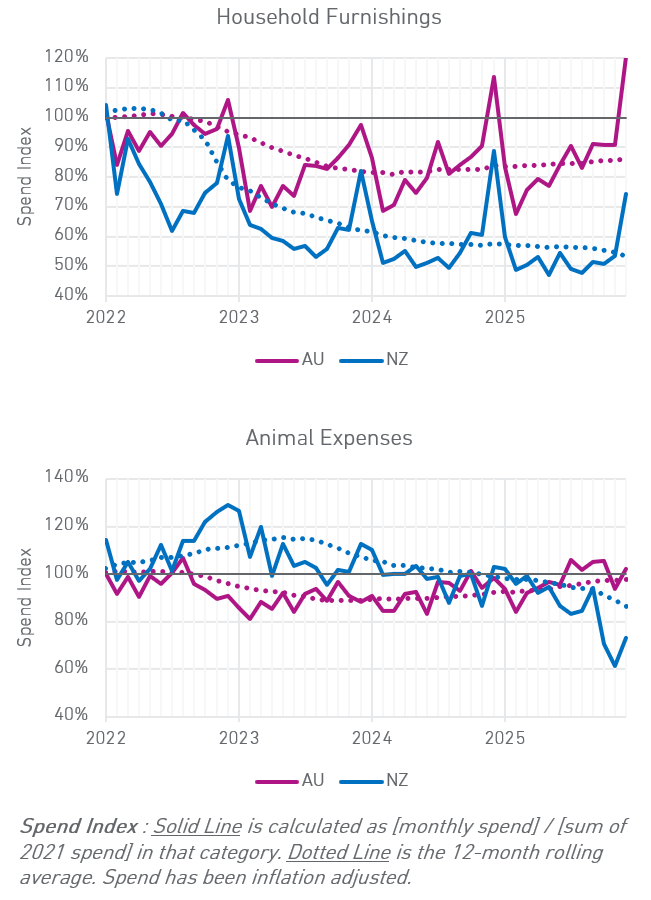 Australia’s animal expenses Spend Index sits at 102% in Dec-25 – essentially flat to the 2021 baseline – having oscillated without a decisive trend throughout the period. Despite cost-of-living pressures, this spending is very much a non-negotiable emotional expenditure.
The similar flat trend can be observed in New Zealand historically – however data over the last 6-8 months showing a more cautionary tale – the latest spend index for animal expenses is 73%. Pet owners have been more willing (or rather forced) to more economically rational – expensive vet visits might be deferred or skipped, or more affordable food options for their furry friends.
The digital goods category (streaming services, software subscriptions, in-app purchases, gaming) is one of the most textbook examples of the “affordable luxury” thesis. When consumers cannot afford a TV, they spend $15 a month on a TV subscription service. The data supports this substitution in Australia – although down from 2021 levels, New Zealand spend in this category is trend up slightly over the past year.
Australia’s digital goods Spend Index has increased from 108% in Jan-22 to 151% in Dec-25, with a rolling average of 128%. This is a 28% structural step-up in spending that shows no sign of reversing with streaming proliferation, the subscription gaming market, and the explosion of subscription-based pricing. One could also think of digital goods behaving more like utilities now rather than discretionary spend. Once a consumer or household is subscribed to Netflix, Spotify, iCloud, Office, cancelling them feels more like a “deprivation of a necessity” rather than a “smart financial decision”.
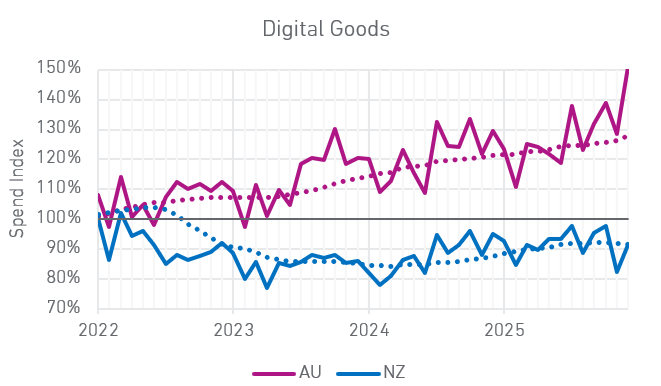
We see this behaviour in New Zealand, albeit to a lesser degree. The digital goods index, by contrast, sits at 92% in Dec-25, marginally below the 2021 baseline, but it has been increasing since 2024. The deeper economic distress that NZ faced in 2023/2024 (compared to AU) probably forced households to audit even their subscription stacks – but now confidence is returning, users are returning as well.
Small escapes, sticky demand: The rise of creator‑led digital subscriptions
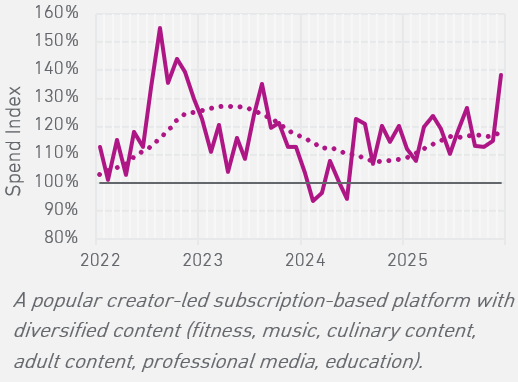 Spending on creator‑led digital subscription platforms in Australia has continued to grow over the past three years. These low‑commitment, high‑perceived‑value indulgences offer personalisation, immediacy and emotional engagement at a relatively modest price point.
Consumers appear more willing to preserve spend on digital experiences that deliver ongoing connection, entertainment and escapism, reinforcing the resilience of “micro/ affordable‑escapism”.
Sky’s the limit: The non-negotiable funding of travel and leisure
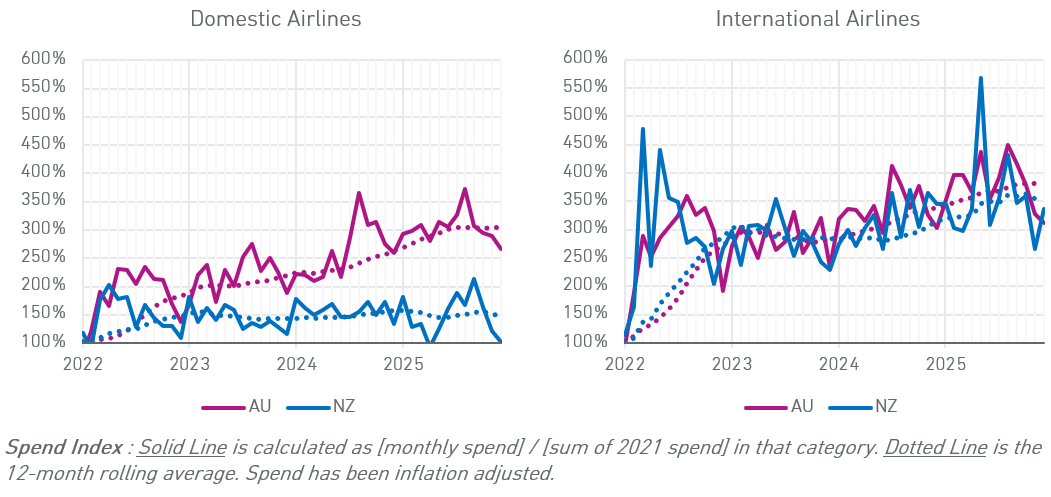 Airline travel spend across both domestic and international settings have increased dramatically, despite challenges with consumer cost-of-living over the past few years. AU Spend Index for domestic reached 266% – that’s 166% more spend than our baseline. It’s even higher on international spend – 311% and 337% for AU and NZ respectively. While 2021 baselines may have been artificial low (just coming out of COVID restrictions), the continuing upward trend is clear.
Consumers perhaps have pivoted towards more affordable experiences, away from costly goods and major life purchases. If buying a property is no longer viable in this market and that kitchen renovation is financially out-of-reach – one might as well make some memories on a holiday.
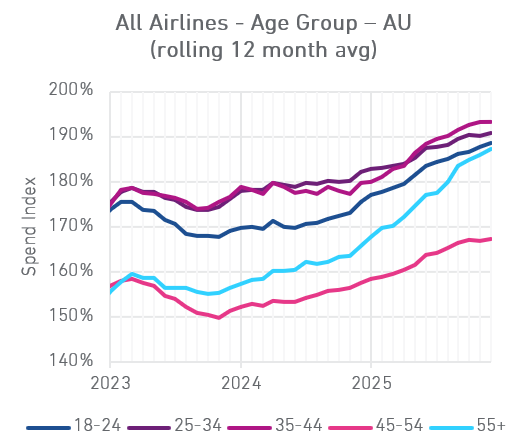 Data shows the greatest increase in Spend Index across the 55+ and 25-44 cohorts. Near-retirees with paid-down mortgages and benefitting from elevated interest rates returns on their savings have the means (and desire) to travel. The middle cohorts – consumers with dual-incomes, not yet at peak mortgage stress (if they even have a mortgage at all), taking advantage of budget airlines and holiday deals.
The strength of the AUD would have also helped, in particular, for key popular destinations (e.g. Japan, Bali, Vietnam, New Zealand).
Forking the bill: Dining, socialising and small indulgences
The divergence between Australia and New Zealand is evident when it comes to dining and socialising. Australian consumers sustained spending on cafes, pubs and restaurants, despite cost-of-living pressures, highlights the social-emotional function of dining. A stronger labour market (compared to NZ) would also mean, even though wallets are stretched, there is still an appetite for going-out. Australia’s multicultural food scene is wildly-varied with many options at very accessible price points and higher urban density in hubs and food precincts would create strong spending demand.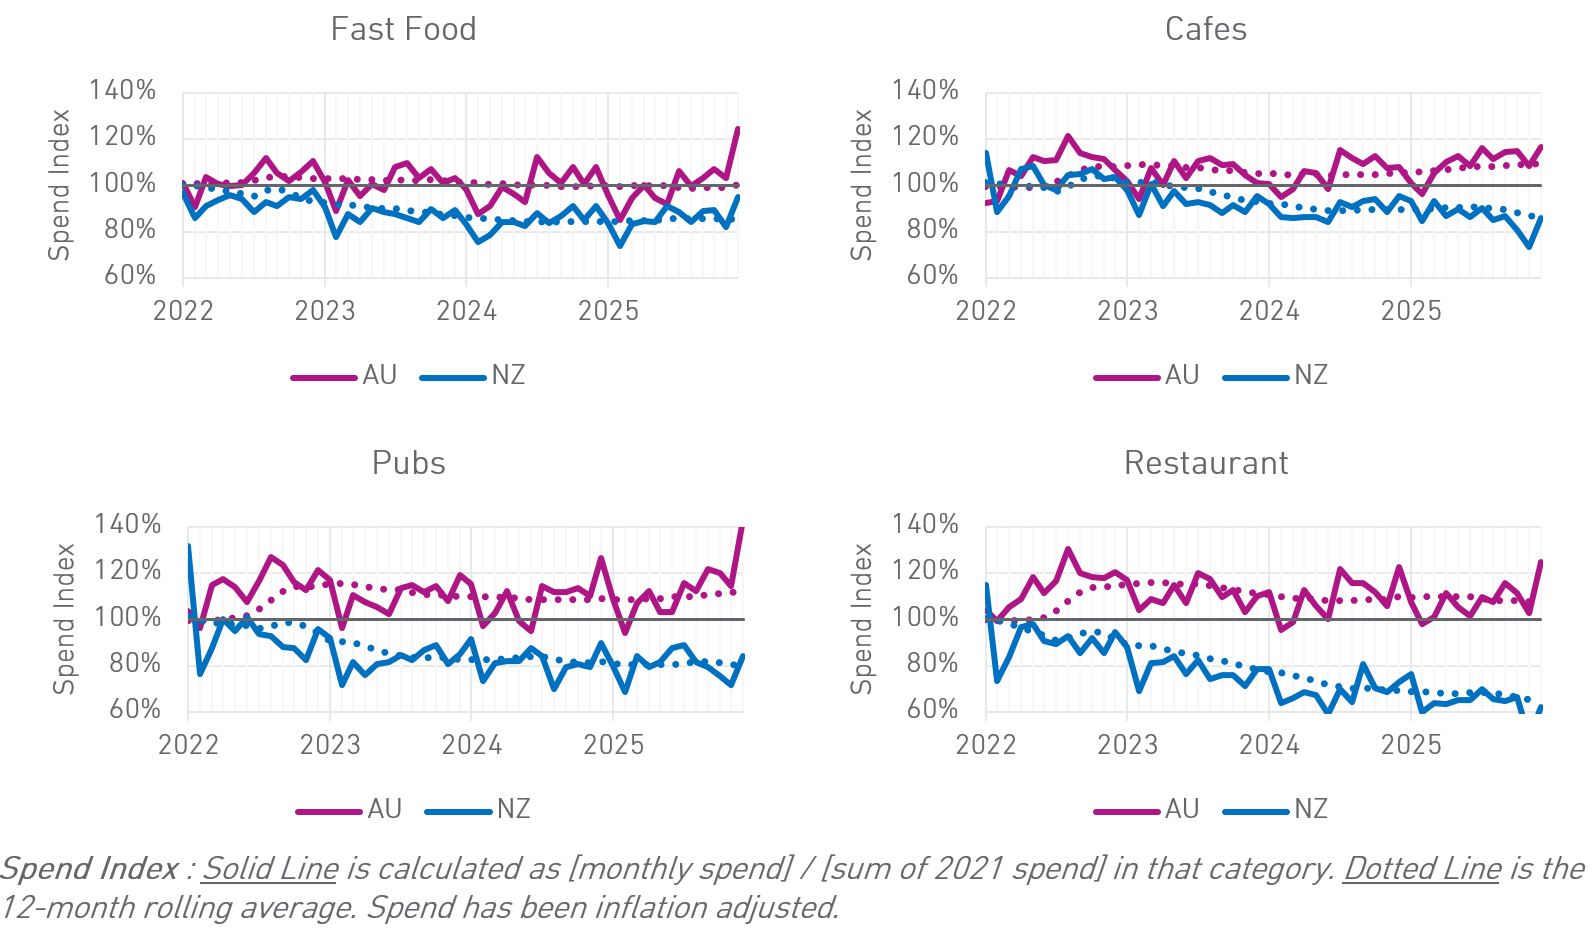
Aussies have increased pub spend through the rate hike cycle – testament to the social anchoring function of the venue and to the relative health of Australian labour markets and consumer confidence. The RBA’s slower, less aggressive tightening cycle preserved enough consumer surplus to keep the mid-week round going.
How can we help?
Market insights provide our clients with a deep understanding of their competitive landscape, customer behaviour and market dynamics. By leveraging internal data, industry benchmarks, and external market intelligence, these services can help uncover trends, identify growth opportunities, and inform strategic decision-making. Turn market intelligence into competitive advantage with data-driven insights that drive growth. Contact us to find out how.
Like what you’re reading? We release the Experian Business Pulse Monthly each month and features a Spotlight topic, much like this article. To get the latest reports directly to your inbox, be sure to subscribe.
Contact Us
Disclaimer: This report is provided by Experian Australia Pty Ltd general information and it is not (and does not contain any form of) professional, legal or financial advice. Experian and its related bodies corporate make no representations, warranties or guarantees that the information (including links and the views / opinions of authors and / or contributors) contained in this report are error free, accurate or complete. You are solely responsible and liable for any decision made (or not made) by you in connection with the information contained in this report. Experian (and its related bodies corporate) exclude, to the extent permitted by law, all liability for any and all loss, cost, expense, damage or claim incurred by a party as a result of or in connection with (whether directly or indirectly) this report or any reliance on the information in this report or links contained within. Nothing in this disclaimer excludes, restricts or modifies any rights or remedies that cannot be excluded, restricted or modified under applicable law. Experian and its related entities own, or are licensed to use, the intellectual property rights in this report and its contents. Except as permitted by law, the contents of this report must not be reproduced, modified, distributed or republished without Experian’s prior written consent.
Experian and the Experian marks used herein are service marks or registered trademarks of Experian or its related entities worldwide. Other product and company names mentioned herein are the property of their respective owners.