
Cost-of-living pressures
Between 2022 and 2025, Australia experienced significant rise in cost-of-living pressures driven by inflation, interest rate hikes, and housing affordability challenges. Inflation peaked in late 2022, with the Consumer Price Index (CPI) reaching 8.4% in December, before gradually easing to around 2.4% by mid-2025. This decline was largely attributed to the Reserve Bank of Australia’s (RBA) aggressive monetary tightening, which saw multiple consecutive cash rate rise. These rate hikes helped curb demand-side inflation but also increased mortgage repayments, contributing to financial stress for households.
Housing affordability deteriorated markedly during this period as median house prices in capital cities surged, except for Melbourne. Rising interest rates compounded the issue, making mortgage repayments significantly more expensive, while also impacting renters as increasing costs were passed on. While inflation has now returned to the RBA’s target band, the broader affordability crisis continues to impact Australian households.
Delinquency trends
Delinquency rates rose sharply from September 2022, peaking at 1.2% in April 2023. This stress was primarily brought on by high inflation over the preceding 12 months and the corresponding rapid increase in the cash rate (CR) from 0.1% to 2.4% over the course of 5 months, and then up to 4.4% by the end of 2023. Delinquency rates then moderated to a degree but saw a second significant rise in the back end of 2024, possibly caused by the sustained period of elevated interest rates and living costs.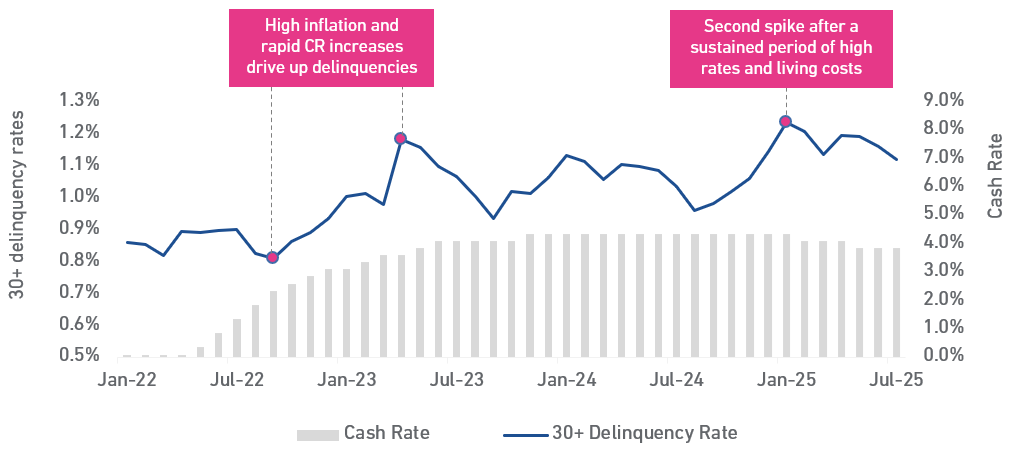
In the following analysis, we detail which types of consumers have been affected the most for lines of credit across personal loans, mortgages and credit cards. We utilise Experian’s Mosaic profiles to differentiate between various consumer groups, as well as explore geographical differences.
What is Mosaic?
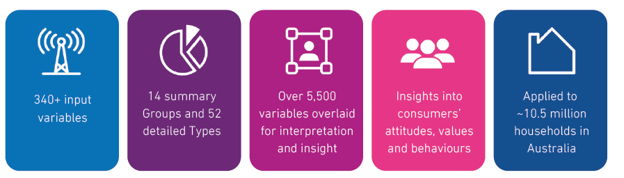
Mosaic is Experian’s comprehensive consumer classification solution that aggregates households across Australia into 14 different groups. This grouping, based on the consumer’s likely demographics, lifestyle, behaviours and preferences, allows a consistent way to describe customers and helps understand and predict consumer behaviour.
The following table lists the 14 Mosaic groups and their relative increase in 30+ day delinquency rates from 2022 to 2023 per credit type. Several groups jump out as being most impacted by the rapid rise in interest rates and living costs over this period.
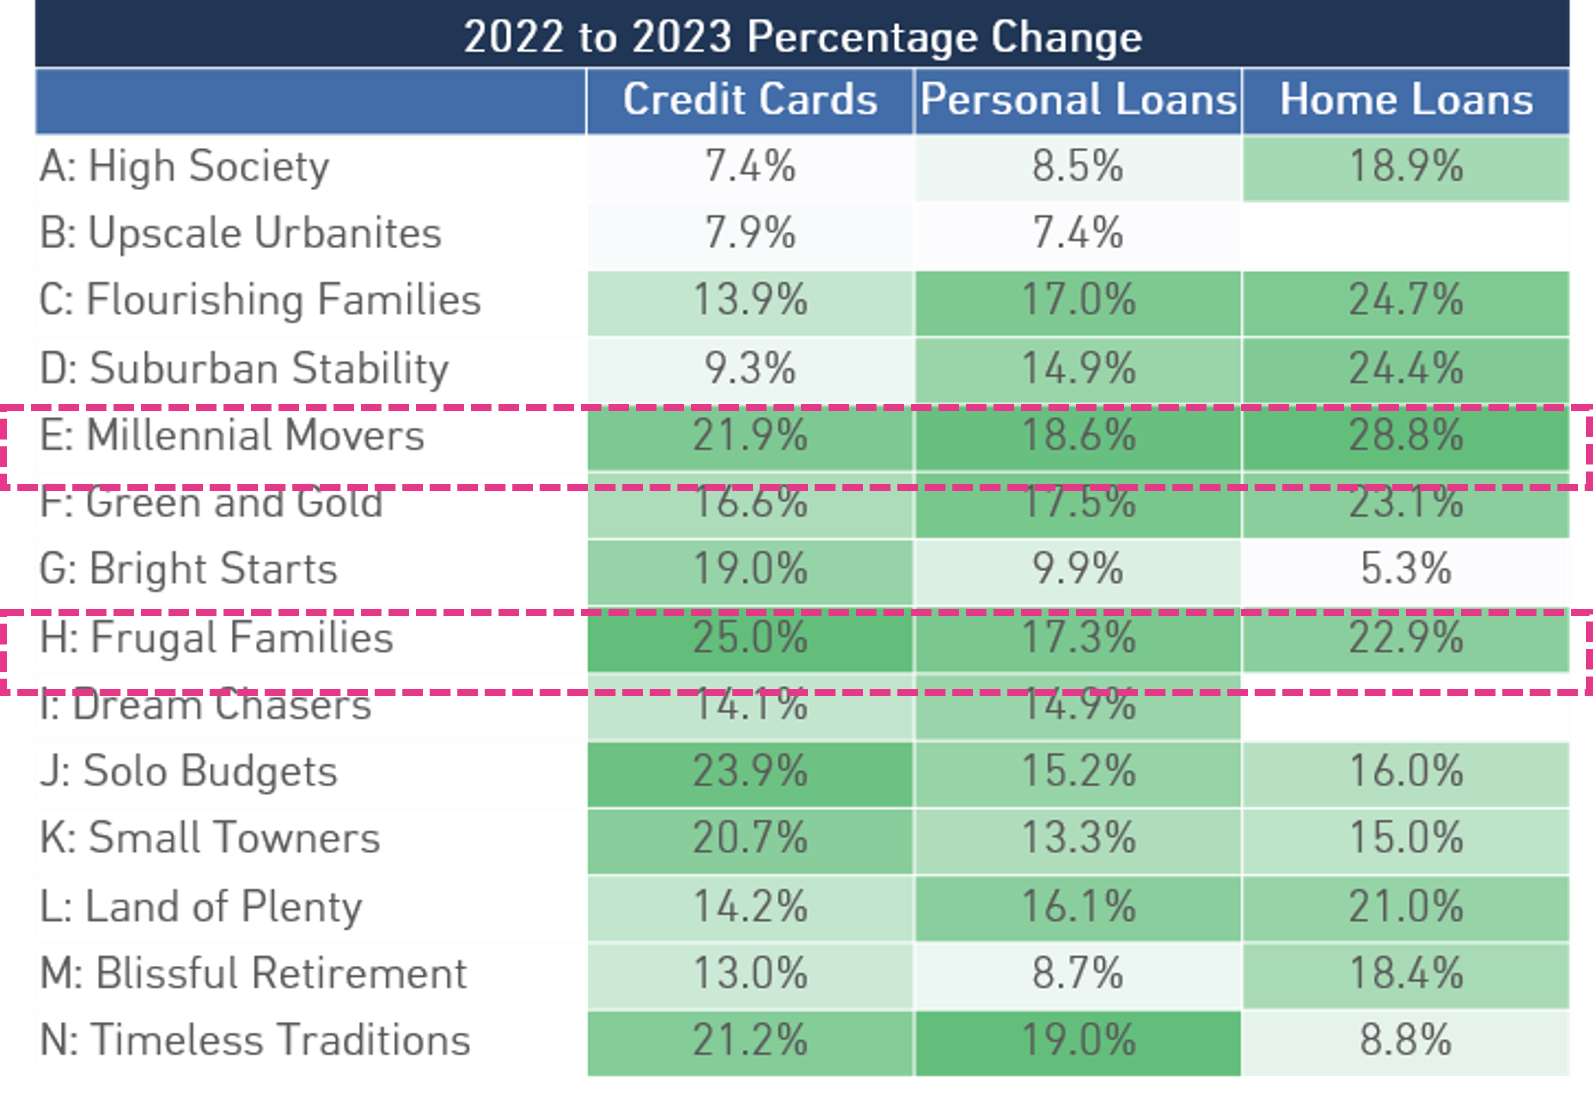
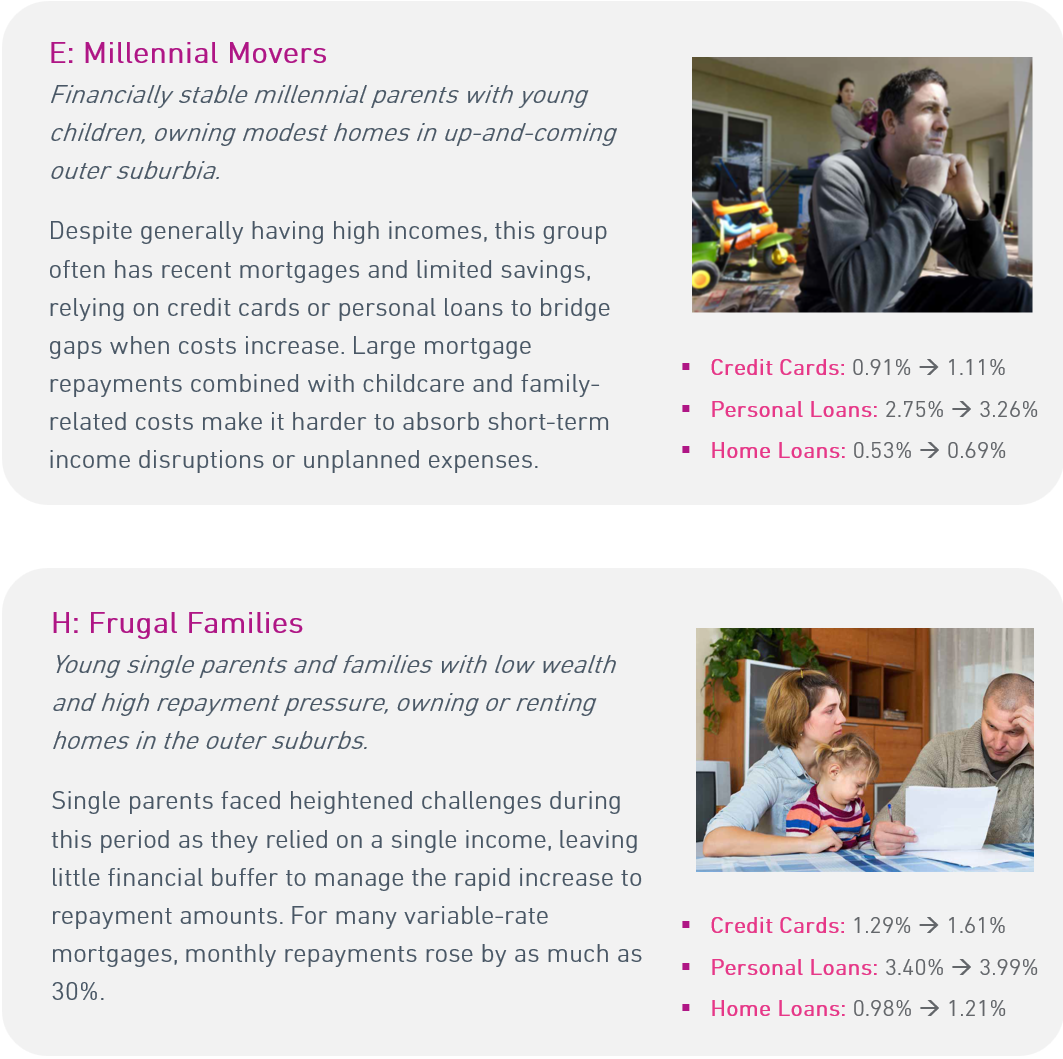
Delinquency rates have increased the most for Mosaic groups that are characterised by families, single parents, and those with recent or large mortgages. Groups such as Millennial Movers (+21.9% credit cards, +18.6% personal loans, +28.8% home loans), Frugal Families (+25.0%, +17.3%, +22.9%), and Green and Gold (+16.6%, +17.5%, +23.1%) recorded some of the highest percentage changes, particularly in home loans and credit cards.
These patterns suggest that rising interest rates and cost-of-living pressures disproportionately impacted households juggling significant housing debt and family-related expenses, leaving them more vulnerable to financial stress compared to other demographic groups.
Mixed Movements: Jan-24 to Jul-25
The following table shows the change in delinquency rates for the first half of 2025 compared to the same period in 2024.
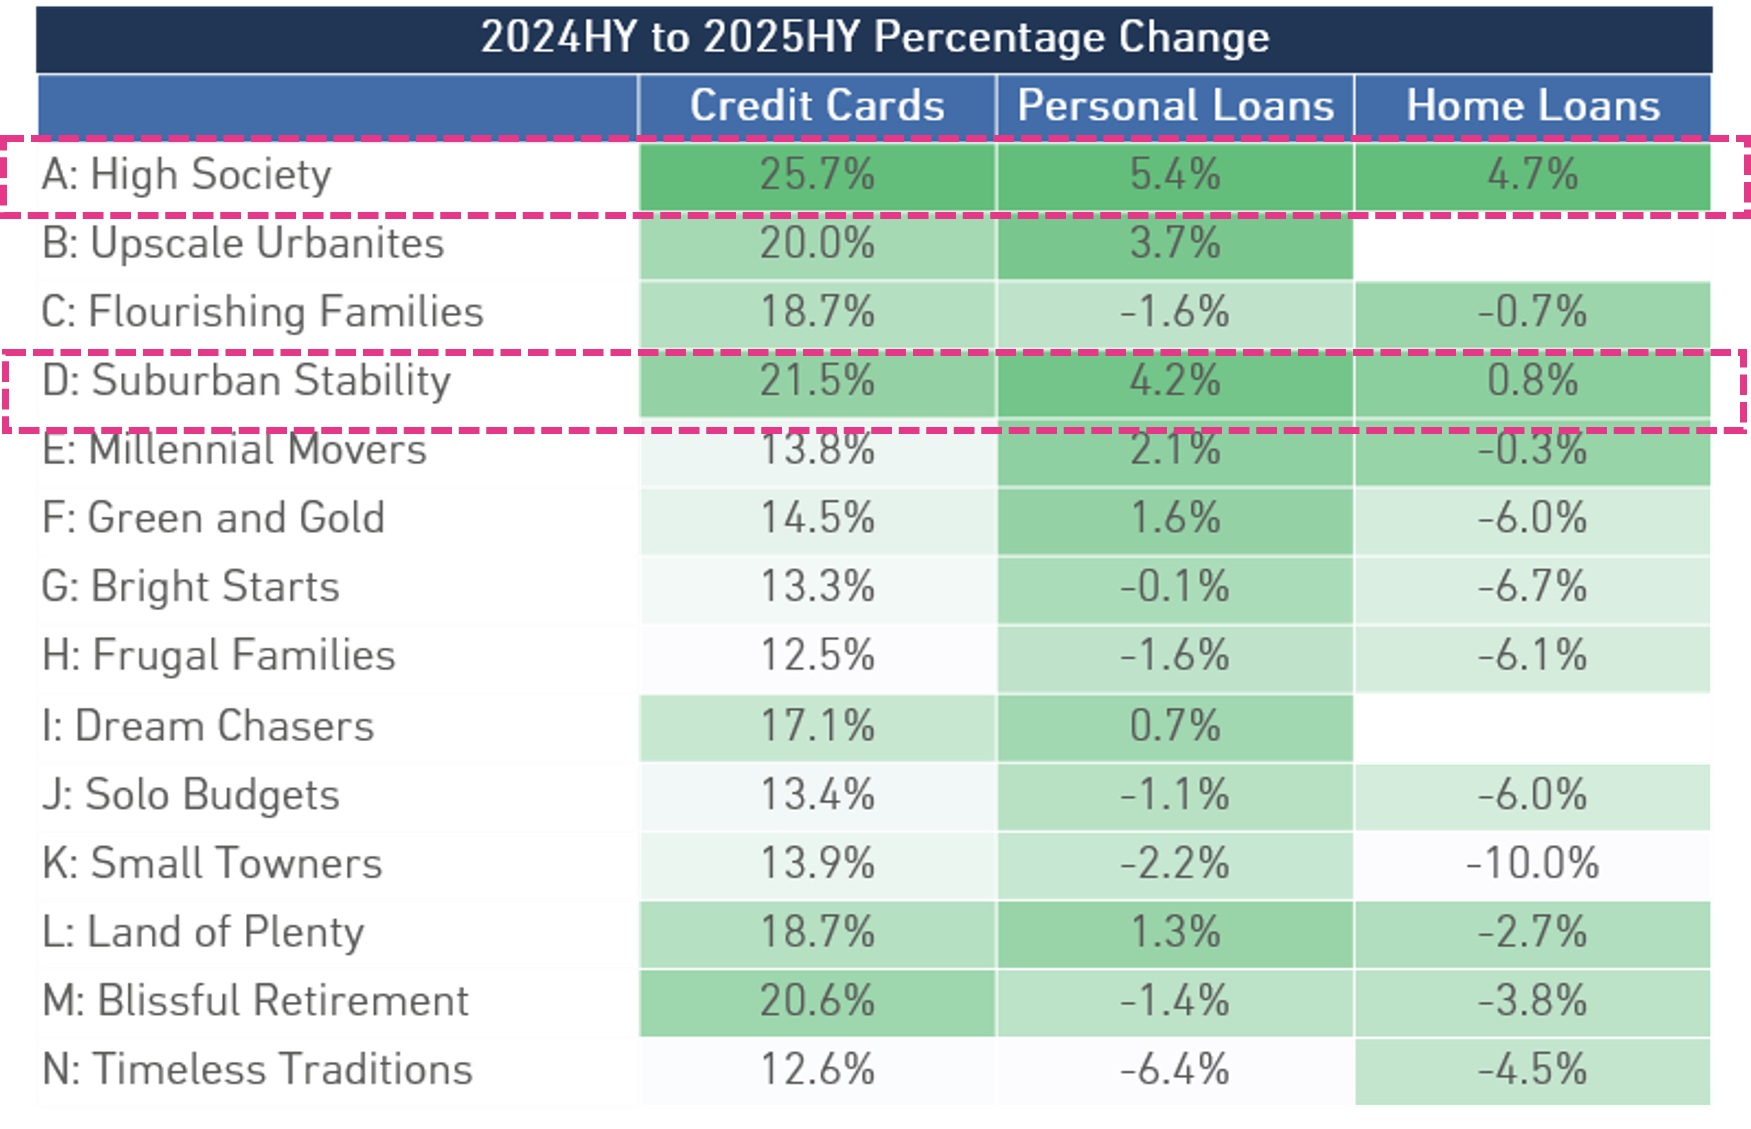
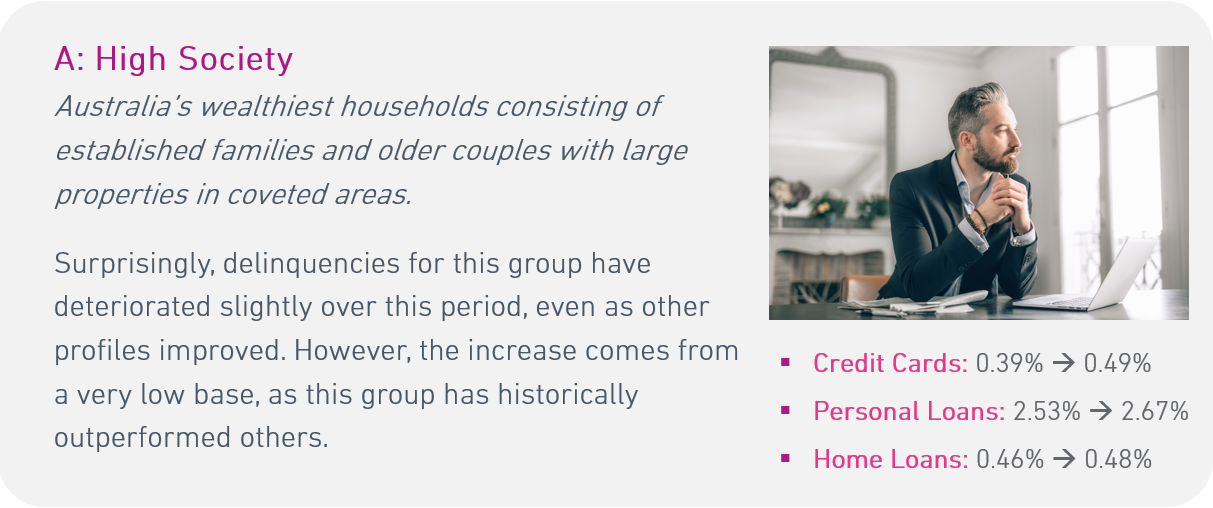
Credit card delinquencies have risen across all socio-demographic profiles; personal loan delinquencies vary but have largely been negligible movements; while home loan delinquencies have generally decreased across most groups.
Borrowers tend to prioritise mortgage and personal loan repayments to protect assets like homes and vehicles and unsecured credit like credit cards becomes the first area where payment delays occur. Additionally, we have seen banks become more prudent with their lending, reducing high loan-to-value and high debt-to-income lending.
Geographic disparities
Personal Loans
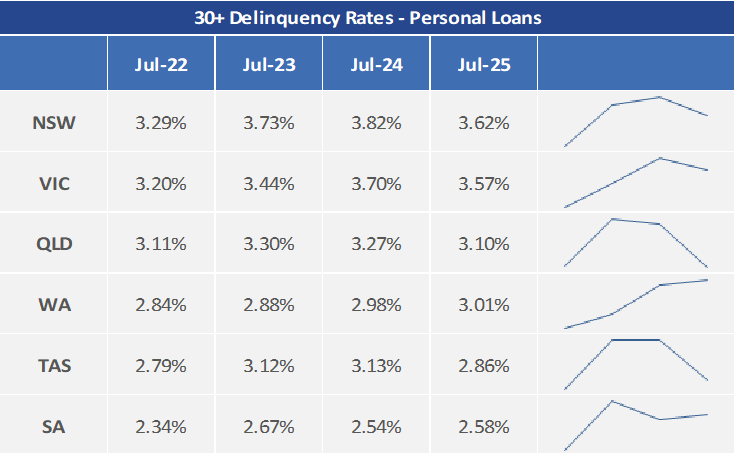 Personal loan delinquency rates for most states peaked during 2023 and 2024 before easing slightly in 2025. However, NSW and Victoria’s relative positions have worsened compared to the other states.
NSW rose from 3.29% in July 2022 to 3.82% in July 2024, then declined to 3.62% in 2025. A similar pattern is seen in Victoria, which climbed from 3.20% to 3.70% before easing to 3.57%.
Home Loans
There has been some notable shifts in home loan delinquency rates across Australia since 2022. In July 2022, Victoria had the lowest delinquency rate at 0.55%, outperforming all other states. However, by July 2025, Victoria’s rate climbed to 0.87%, making it the highest in the country and suggests sustained financial stress among Victorian borrowers.
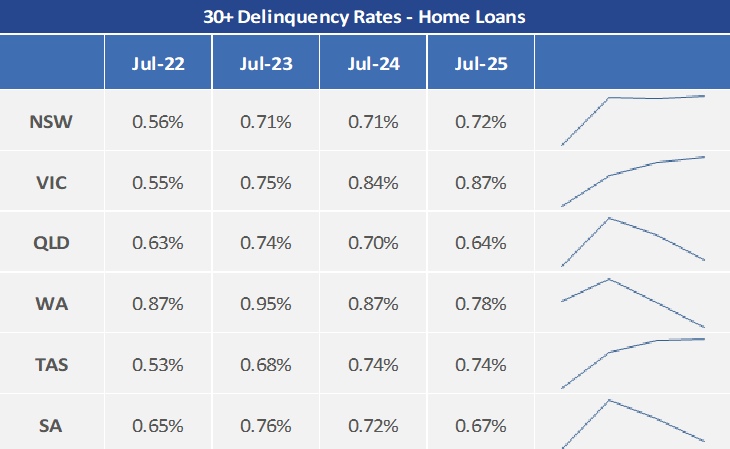
In comparison, after initial spikes there has been an overall moderation of delinquency rates in Western Australia and Queensland. WA started at 0.87% in July 2022 and peaked at 0.95% in 2023 before easing to 0.78% by 2025. Similarly, Queensland saw a decline from 0.74% in 2023 to 0.64% in 2025.
This data underscores regional disparities in resilience to economic and housing market pressures. Some likely contributing factors include Victoria’s slower economic recovery post-pandemic, lower wage growth, and higher unemployment rates compared to WA and Queensland in particular.
How can we help?
Market insights provide our clients with a deep understanding of their competitive landscape, customer behaviour and market dynamics. By leveraging internal data, industry benchmarks, and external market intelligence, these services can help uncover trends, identify growth opportunities, and inform strategic decision-making. Turn market intelligence into competitive advantage with data-driven insights that drive growth. Contact us to find out how.
Like what you’re reading? We release the Experian Business Pulse Monthly each month and features a Spotlight topic, much like this article. To get the latest reports directly to your inbox, be sure to subscribe.
Contact Us
Disclaimer: This report is provided by Experian Australia Pty Ltd general information and it is not (and does not contain any form of) professional, legal or financial advice. Experian and its related bodies corporate make no representations, warranties or guarantees that the information (including links and the views / opinions of authors and / or contributors) contained in this report are error free, accurate or complete. You are solely responsible and liable for any decision made (or not made) by you in connection with the information contained in this report. Experian (and its related bodies corporate) exclude, to the extent permitted by law, all liability for any and all loss, cost, expense, damage or claim incurred by a party as a result of or in connection with (whether directly or indirectly) this report or any reliance on the information in this report or links contained within. Nothing in this disclaimer excludes, restricts or modifies any rights or remedies that cannot be excluded, restricted or modified under applicable law. Experian and its related entities own, or are licensed to use, the intellectual property rights in this report and its contents. Except as permitted by law, the contents of this report must not be reproduced, modified, distributed or republished without Experian’s prior written consent.
Experian and the Experian marks used herein are service marks or registered trademarks of Experian or its related entities worldwide. Other product and company names mentioned herein are the property of their respective owners.